This web page was produced as an assignment for Genetics 564, an undergraduate course at UW-Madison
The study of phylogeny
Phylogeny is the study of the relatedness of species and is founded on the idea that different species arose from a common ancestor. It can be also be used on a smaller scale to indicate how a gene has changed over time. Phylogeny can explain similarities and differences among species and also provide great insight into previous functions of a protein that were lost or new functions gained, which can be correlated with differences that arose within the protein itself. [1] Basic protein phylogeny aligns the amino acid sequences of homologous proteins and then constructs a tree to display how closely related individual homologues are to one another. Both the alignments and tree constructions can be performed multiple ways. To first align the sequences, ClustalW and MUSCLE use a matrix based alignment method that only takes into account more localized sequences. In contrast T-Coffee uses a consistency-based method that considers not only the two sequences being aligned but also how all of the sequences align together. [2]
To construct phylogenetic trees, the average distance method groups closely related samples into a single node and then the branch length reflects the amount of sequence that is the same between the sequences in that node. In contrast, the neighbor joining method starts with a tree with a single node and then groups sequences to achieve the shortest possible branches. This results in a tree with uneven branch length since the rate of mutations is not assumed to be constant throughout time. Each of these types of trees can be derived using BLOSUM62 analysis or Percent Identity. BLOSUM62 uses a matrix to score the likelihood that a different amino acid changes would arise between alignments. In contrast, percent identity measures the number of identical matches to determine the relatedness of sequences.[3,4] Phylogenetic trees using each of these different methods are shown in Figures 1-4 below.
To construct phylogenetic trees, the average distance method groups closely related samples into a single node and then the branch length reflects the amount of sequence that is the same between the sequences in that node. In contrast, the neighbor joining method starts with a tree with a single node and then groups sequences to achieve the shortest possible branches. This results in a tree with uneven branch length since the rate of mutations is not assumed to be constant throughout time. Each of these types of trees can be derived using BLOSUM62 analysis or Percent Identity. BLOSUM62 uses a matrix to score the likelihood that a different amino acid changes would arise between alignments. In contrast, percent identity measures the number of identical matches to determine the relatedness of sequences.[3,4] Phylogenetic trees using each of these different methods are shown in Figures 1-4 below.
phylogenetic trees of tub
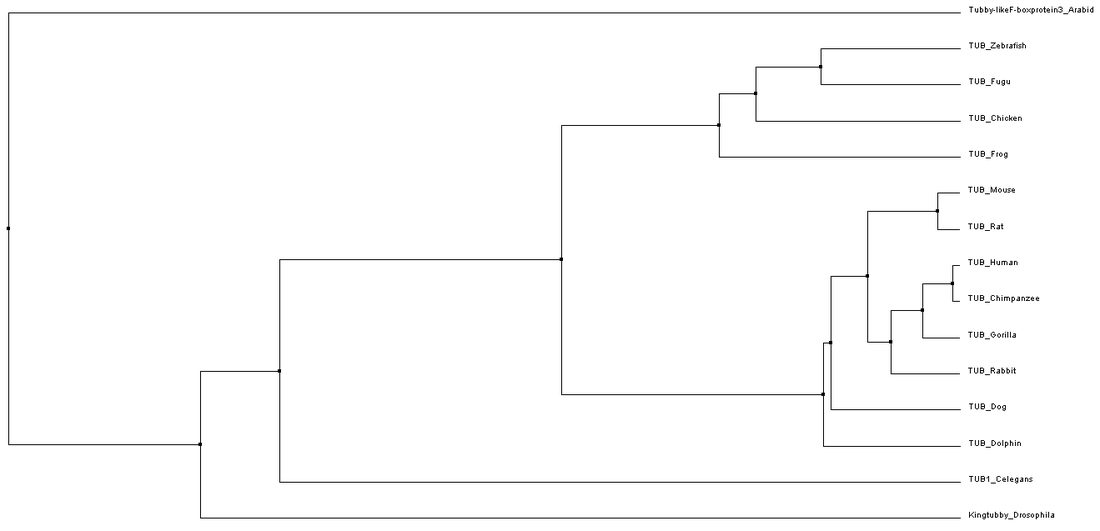
Figure 1. Phylogenetic tree constructed using average distance based on percent identity. The same tree was found using ClustalW2, MUSCLE, and T-coffee alignments. (Click to enlarge)
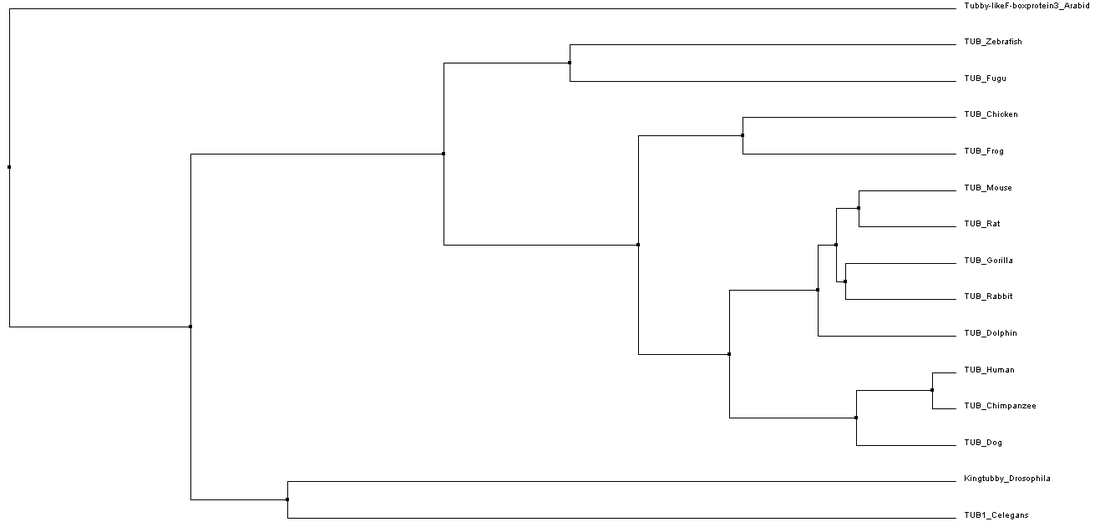
Figure 2. Phylogenetic tree constructed using average distance based on BLOSUM62. The same tree was found using ClustalW2, MUSCLE, and T-coffee alignments. (Click to enlarge)
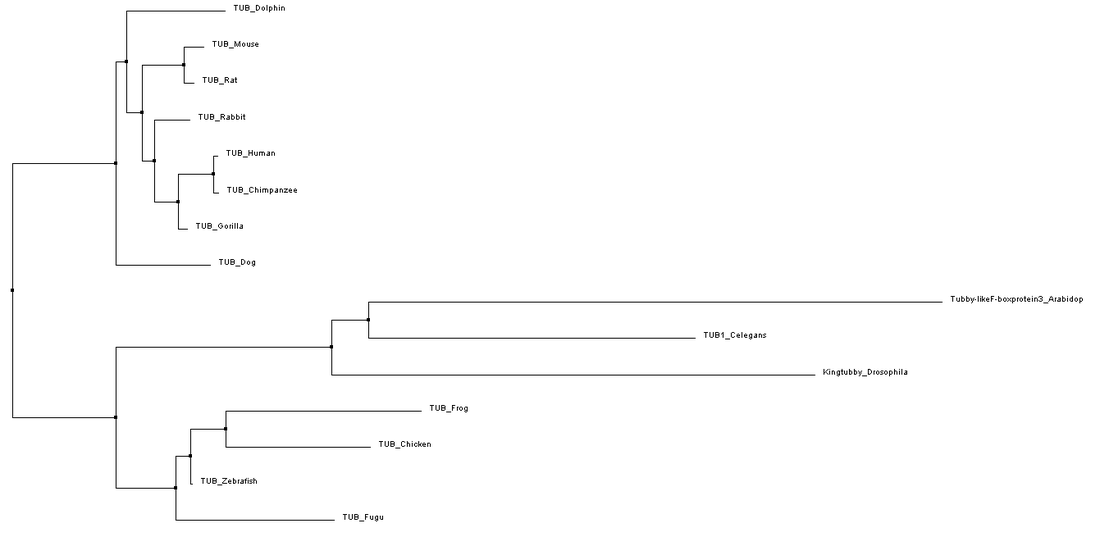
Figure 3. Phylogenetic tree constructed using neighbor joining based on percent identity. The same tree was found using MUSCLE and T-Coffee. (Click to enlarge)
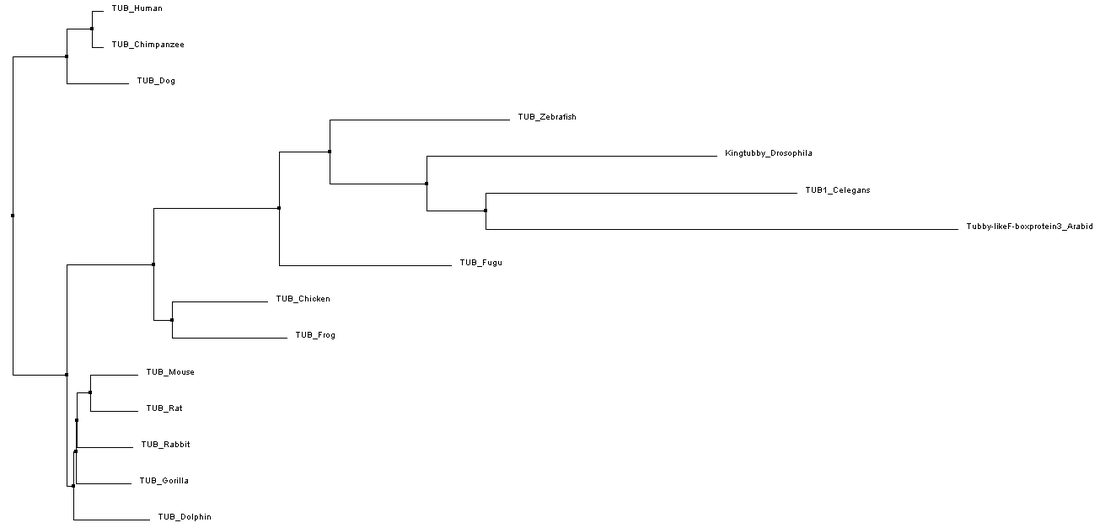
Figure 4. Phylogenetic tree constructed using neighbor joining based on BLOSUM62. The same tree was found using ClustalW2 and MUSCLE. (Click to enlarge)
Analysis of tub phylogeny
While slight phylogenetic differences were found using the different alignment and tree building methods described previously, some common themes can be drawn from studying figures 1-4. In figures 1-3, mammals are grouped at one node, oviparous (egg-laying) animals are found in a separate node, and flatworms, Drosophila, and Arabidopsis are the most distantly related organisms to humans. This information is not very surprising as this fits with overall whole genome based homology between these species. While these general groupings are found in all of the trees shown in figures 1-3, the relatedness of species within these groups was somewhat variable. These variations could potentially be due to the fact that the C-terminal part of the protein is very well conserved causing the relatedness of organisms to be based on the few amino acid differences present.
In contrast, the tree in figure 4 that uses neighbor joining based on BLOSUM62 splits mammals into separate nodes, and predicts that the rodents and gorilla are more closely related to oviparous animals rather than humans, chimps, and dogs. This curious grouping could be due to the fact that the N-terminal part of the protein is highly variable in both length and sequence which could make it difficult to determine when differences in the sequences arose since this part of the protein is now highly variable.
In contrast, the tree in figure 4 that uses neighbor joining based on BLOSUM62 splits mammals into separate nodes, and predicts that the rodents and gorilla are more closely related to oviparous animals rather than humans, chimps, and dogs. This curious grouping could be due to the fact that the N-terminal part of the protein is highly variable in both length and sequence which could make it difficult to determine when differences in the sequences arose since this part of the protein is now highly variable.
References
Cover Photo Credit
[1] Tree of Life: What is Phylogeny?
[2] Gharegozlou, R. (2009). Protein Multiple Sequence Alignment: Benchmarks and Comparisons. Accessed on February 18, 2014.
[3] Delsuc, F., Brinkmann, H., and Philippe, H. (2005). Phylogenomics and the reconstruction of the tree of life. Nature Reviews Genetics, 6, 361. doi:10.1038/nrg1603.
[4] Evolution: Phylogenetic Reconstruction.
Site created by Rachael Baird.
Genetics 564 Assignment, Spring 2014
University of Wisconsin-Madison
Last Updated: 5-9-14
Genetics 564 Assignment, Spring 2014
University of Wisconsin-Madison
Last Updated: 5-9-14
